SCRIPT "TICO TECO" PPAPRA REALIZAR OPERACIONES BINARIAS EN IQ OPTION
By EGYPTIAN EYE TRADING - febrero 03, 2024

OPERAR BINARIAS NUNCA FUE TAN FACIL EN ESTE AÑO
Las operaciones Binarias en las diferentes plataformas tienen un sin numero de herramientas para maximizar sus entradas esto en razón a que las temporalidades que se usan son varias pero un común denominador es que son bajas, por ejemplo 1M, 5M, 15M, lo que buscan los comerciantes de este tipo es obtener ganancias rápidas en las operaciones que realizan.
El SCRIPT TICO TECO es un script de acceso gratuito el cual consta de dos EMA rápidas las cuales se mueven juntamente con el precio.
SEÑAL DE COMPRA:
- Precio por encima de las medias.
- Señal TECO que indica una COMPRA O CALL.
- Si la temporalidad de las velas son 5M la entrada es al finalizar la vela, y tiempo de expiración 5M.
SEÑAL DE VENTA:
- Precio por debajo de las medias.
- Señal TICO que indica una VENTA O SELL.
- Si la temporalidad de las velas son 5M la entrada es al finalizar la vela, y tiempo de expiración 5M.
Para usar este script debes copiar este código y pegarlo en el área de AGREGAR NUEVO SCRIPT, recuerden que deben borrar los datos que se encuentren allí para pegar desde el inicio todo el código.
💀💀💀CODIGO:💀💀💀
--CHAVE DE ACESSO--
key = ('--EFRAIM--'),
instrument { name = 'TICO TECO',
icon = 'https://midia.gruposinos.com.br/_midias/jpg/2020/10/21/download-19246341.jpeg',
overlay = true
}
percentage = input (1, "Percentage", input.double, 1, 100, 3) / 100
period = 5
input_group {
"front.ind.dpo.generalline",
up_color = input { default = "", type = input.color },
width = input { default = 1, type = input.line_width },
visiblepercentage = input { default = false, type = input.plot_visibility }
}
input_group {
"front.ind.dpo.generalline",
down_color = input { default = "", type = input.color },
width = input { default = 1, type = input.line_width },
visiblepercentage = input { default = false, type = input.plot_visibility }
}
input_group {"CALL", call_color= input{ default= "rgba(0, 250, 154, 0.80)", type= input.color}}
input_group {"PUT", put_color= input{ default= "rgba(220, 20, 60, 0.8)", type= input.color}}
local reference = make_series ()
reference:set(nz(reference[1], high))
local is_direction_up = make_series ()
is_direction_up:set(nz(is_direction_up[1], true))
local htrack = make_series ()
local ltrack = make_series ()
local pivot = make_series ()
reverse_range = reference * percentage / 100
if get_value (is_direction_up) then
htrack:set (max(high, nz(htrack[1], high)))
if close < htrack[1] - reverse_range then
pivot:set (htrack)
is_direction_up:set (false)
reference:set(htrack)
end
else
ltrack:set (min(low, nz(ltrack[1], low)))
if close > ltrack[1] + reverse_range then
pivot:set (ltrack)
is_direction_up:set(true)
reference:set (ltrack)
end
end
color = is_direction_up() and up_color or down_color
plot(pivot, 'ZZ', color, width, -1, style.solid_line, na_mode.continue)
smaa= sma(close, '1')
upper_high= smaa + (stdev(close,10) *1 )
lower_high= smaa - (stdev(close,10) *1 )
emaa= ema(close, '')
if Exibir_tracamento == 1 then
plot(emaa, "SMA", ema_color)
plot(upper_high, "UPPER_HIGH", sup_color)
plot(lower_high, "LOWER_HIGH", inf_color)
end
plot_shape((high >= upper_high and emaa > upper_high),
"PUT",
shape_style.arrowdown,
shape_size.huge,
put_color,
shape_location.abovebar,
0,
"TICO",
put_color)
plot_shape((low <= lower_high and emaa < lower_high),
"CALL",
shape_style.arrowup,
shape_size.huge,
call_color,
shape_location.belowbar,
0,
"TECO",
call_color)
instrument { name = 'TICO TECO',icon='https://midia.gruposinos.com.br/_midias/jpg/2020/10/21/download-19246341.jpeg', overlay = true
}
exibir_tracamento = input ( 1, "Desea exibir?", input.string_selection, {"SI","No"})
input_group { "SMAA", smaa_color = input{ default = "yellow", type = input.color }}
input_group { "SMAB", smab_color = input{ default = "rgba(0, 0, 255, 0.8)", type = input.color }}
sec = security(current_ticker_id, "1m")
smaa = ema(close, '10')
smab = ema(close, '20')
smaao = ema(open, '10')
smabo = ema(open, '20')
plot(smaa, "EMA", smaa_color)
plot(smab, "EMA", smab_color)
emaa = ema(close, '20')
period = input (12, "front.period", input.integer, 1)
source = input (1, "front.ind.source", input.string_selection, inputs.titles)
fn = input (1, "front.newind.average", input.string_selection, averages.titles)
local sourceSeries = inputs [source]
local averageFunction = averages [fn]
mean = averageFunction (sourceSeries, period)
mad = sourceSeries - mean
rect {
first = 0,
second = mad,
color = mad >= mad [1] and up_color or down_color,
width = 0.4
}
if
( mad <= 0 and ( mad[1] > mad) and (smaa < smab) and (smaao > smabo) and close <= emaa ) then
plot_shape (1,
"Down",
shape_style.arrowdown,
shape_size.auto,
down_color,
shape_location.abovebar,
0,
" Down ",
1)
end
if
( mad >= 0 and (mad > mad[1]) and (smaa > smab) and close >= emaa and smaao < smabo)
then
plot_shape (1 ,
"Up",
shape_style.arrowup,
shape_size.auto,
up_color,
shape_location.belowbar,
0,
"Up",
1)
end
--CHAVE DE ACESSO--
Key = ('--EFRAIM--')
Todo el código antes expuesto una vez agregado el nuevo script procederá a dar click en agregar al grafico y guardar el mismo.
habiendo seguido todos los pasos ya tendrás en tu grafica el script recomiendo usar temporalidades altas y alejarse de la temporalidad de 1M la cual no ofrece mucha información y por temas de volatilidad te hara muchas señales falsas.
PERFECT TICKETS WITH PERFECT LOTAGE
The foreign exchange market, or Forex, is one of the largest and most liquid financial markets in the world. Forex traders operate with different position sizes, and one of the most important concepts to understand is "lotage." The lot not only determines how much you are investing in a trade, but it also influences your level of risk and profit potential. In this guide, we will explain what lotting is in Forex and how to calculate it properly.
What is Lotting in Forex?
The lot refers to the size of the position you take in a Forex trade.
It is important to understand that lotting is a standard measure used to quantify the volume of a trade.
amount of money I intend to risk
amount of money I intend to risk
lotage= __________________________________________
sl size X forex pip value

There are three main types of lotting:
- Standard Lot: A standard lot is equivalent to 100,000 units of the base currency. For example, if you are trading the EUR/USD pair and you buy a standard lot, you are buying 100,000 euros.
- Mini Lot: A mini lot is equivalent to 10,000 units of the base currency. If you buy a mini lot in the EUR/USD pair, you are buying 000 units of the base currency. If you buy a mini lot in the EUR/USD pair, you are buying 000 units of the base currency. If you buy a mini lot in the EUR/USD pair, you are buying
Micro Lot
A micro lot is the smallest type of lot you can use when trading in the forex market.
Important Features of the Micro Lot:
- Accessibility: The micro lot is ideal for beginner traders or those who want to trade Forex with limited initial capital. With just a small investment, you can start participating in the forex market and learn how it works without taking on significant risk.
- Risk Management: The micro lot allows for very precise risk management. You can adjust your positions and stop-loss more granularly to control the risk on each trade. This is useful to limit losses and maintain strict control over your capital.
- Learning: Trading micro lots is a great way to gain experience without
- Flexibility: With micro lots, you can diversify your operations more easily. Instead of focusing on just one currency pair, you can trade
- Cost: Since the trade size is small, the commissions and transaction costs associated with micro lots are usually lower compared to larger lots.
Micro Lot Example:
Let's say you want to trade the EUR/USD currency pair using a micro lot. If you buy a micro lot of EUR/USD, you are buying 1,000 euros. If the price of EUR/USD increases by 10 pips, you would earn 10 times the value of one pip in a micro lot trade. Likewise, if the price decreases by 10 pips, you would lose 10 times the value of one pip.
In summary, the micro lot is a valuable tool in the Forex market that allows traders to trade flexibly and manage risk efficiently, especially when they are starting out or want to trade with limited capital. This option offers an accessible and gradual way to immerse yourself in the exciting world of forex trading.

Automate Your Telegram or WhatsApp Binary Signals
By EGYPTIAN EYE TRADING - octubre 02, 2023
Would you like to operate when you are not in front of the computer?
Time has always been a limitation when operating, being in front of the computer looking for the right moment where all our strategies come together to make our purchase or sale requires patience. For this reason, several Traders have chosen to pay for programmed signal systems, which are distributed through the Telegram or WhatsApp platforms where they regularly receive information on when to buy and when to sell whether in the Forex or Binary market. Thus, today we are going to focus on the BINARY signals of any platform. We must not forget that most brokers follow the movements of the forex market, which is why the same graph that you see in some broker like IQ OPTION It is the same graph that you will see in LIBERTEX or POKECT OPTION. That is why every time you receive a binary signal you receive it in the following format:
- EUR/USD;CALL;12:55;5M
Where you can see that:
- EUR/USD: refers to the currency pair to operate in this case, the EURO AGAINST THE DOLLAR
- CALL: indicates the direction to take, being call for purchases or increases and put for sales or decreases.
- 12:55: the time at which said entry will be made
- 5M: symbolizes the time that the operation will take, in this case 5 minutes.
But what happens if they send me many signals and I don't want to operate them manually? Well, for that there are several ways, in this case robots that connect with your broker where you can program the entries manually and when you leave the computer on the entries will be made one by one in the selected currency at the time you have programmed it, being able to So you can take the day off and do other types of activities. The TOP WIN free license robot in version 4.0

offers this SIGNAL LIST service where each of them can be added manually or, failing that, create a NOTE BLOCK where our signal should be in the following format:
- EURGBP,call,12:35,1
The difference from how it is often presented to you is that for the TOP WIN robot to read the signals, it must be located by its operating currency followed by a comma (,), the address in English (call or put), the time and The duration is 1 minute (1) 5 minutes (5) etc. It must be taken into account that if it is required to do it in other time frames we must do it in binary because the digital form only allows 1,5,15 minutes respectively.
Bandas de Bollinger: Estrategias, Interpretación y Aplicación en el Trading
By EGYPTIAN EYE TRADING - septiembre 25, 2023
Introducción:
¿Qué son las Bandas de Bollinger?
Las Bandas de Bollinger son un indicador técnico utilizado en el análisis técnico de los mercados financieros. Consisten en tres líneas: una banda superior, una banda inferior y una banda central (que generalmente se basa en una media móvil simple).
Cómo se Calculan las Bandas de Bollinger:
Las Bandas de Bollinger se calculan utilizando tres componentes principales:
- Banda Central: Por lo general, se calcula como una media móvil simple (SMA) de un período determinado, como 20 días.
- Banda Superior: Se obtiene sumando dos veces la desviación estándar de los precios al período de la banda central.
- Banda Inferior: Se obtiene restando dos veces la desviación estándar de los precios al período de la banda central.
Interpretación de las Bandas de Bollinger:
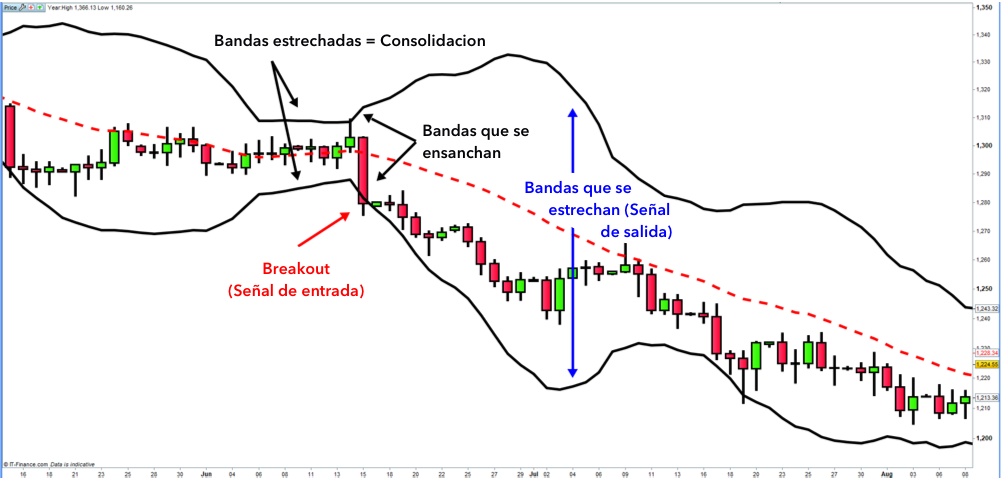
- Volatilidad: Las bandas se expanden y contraen según la volatilidad del mercado. Bandas más anchas indican mayor volatilidad, mientras que bandas más estrechas señalan menor volatilidad.
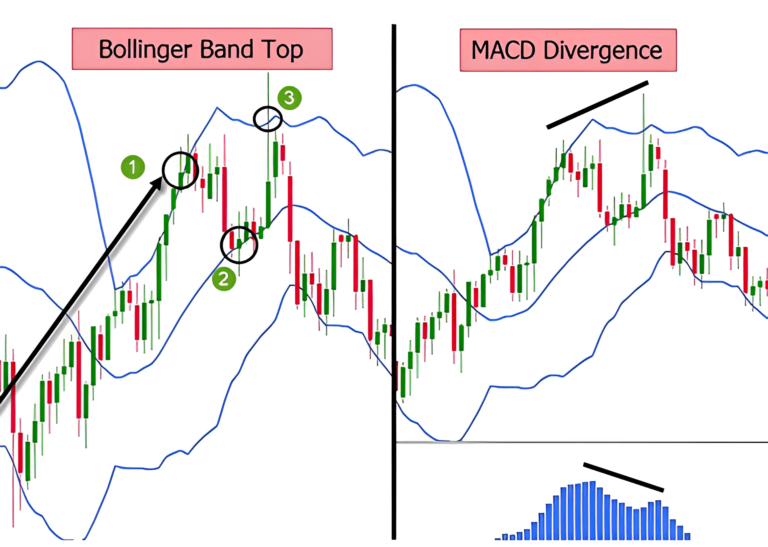
- Sobrecompra y Sobreventa: Cuando el precio toca la banda superior, puede estar sobrecomprado, lo que podría sugerir una posible reversión a la baja. Por otro lado, cuando el precio toca la banda inferior, puede estar sobrevendido, lo que podría indicar una posible reversión al alza.
Estrategias de Trading con Bandas de Bollinger:
- Operaciones de Rango: Las bandas pueden ayudarte a identificar condiciones de rango y buscar oportunidades de compra cerca de la banda inferior y oportunidades de venta cerca de la banda superior.
- Operaciones de Tendencia: Cuando las bandas se expanden, puede indicar una tendencia en desarrollo. Busca confirmaciones adicionales y úsalas como puntos de entrada o salida.
- Divergencias: Busca divergencias entre las Bandas de Bollinger y el precio para identificar posibles puntos de inversión de tendencia.
Conclusión:
Las Bandas de Bollinger son una herramienta versátil y poderosa para cualquier trader. Sin embargo, como con cualquier indicador, es importante utilizarlas en conjunto con otros análisis y estrategias. Al comprender cómo funcionan las Bandas de Bollinger y cómo interpretar sus señales, puedes tomar decisiones de trading más informadas y mejorar tu éxito en los mercados financieros. ¡Empieza a experimentar con este indicador y descubre cómo puede impulsar tu rendimiento en el trading!
Dominando el RSI en el Trading: Estrategias, Consejos y Técnicas Avanzadas
By EGYPTIAN EYE TRADING - septiembre 25, 2023
Introducción:
El Relative Strength Index (RSI) es una herramienta esencial para cualquier trader que busca entender y analizar el mercado financiero. En este artículo, exploraremos en profundidad qué es el RSI, cómo funciona y cómo puedes utilizarlo para tomar decisiones de trading más informadas. Además, te proporcionaremos estrategias y consejos avanzados para maximizar tus ganancias y minimizar tus riesgos al operar con RSI.
¿Qué es el RSI?
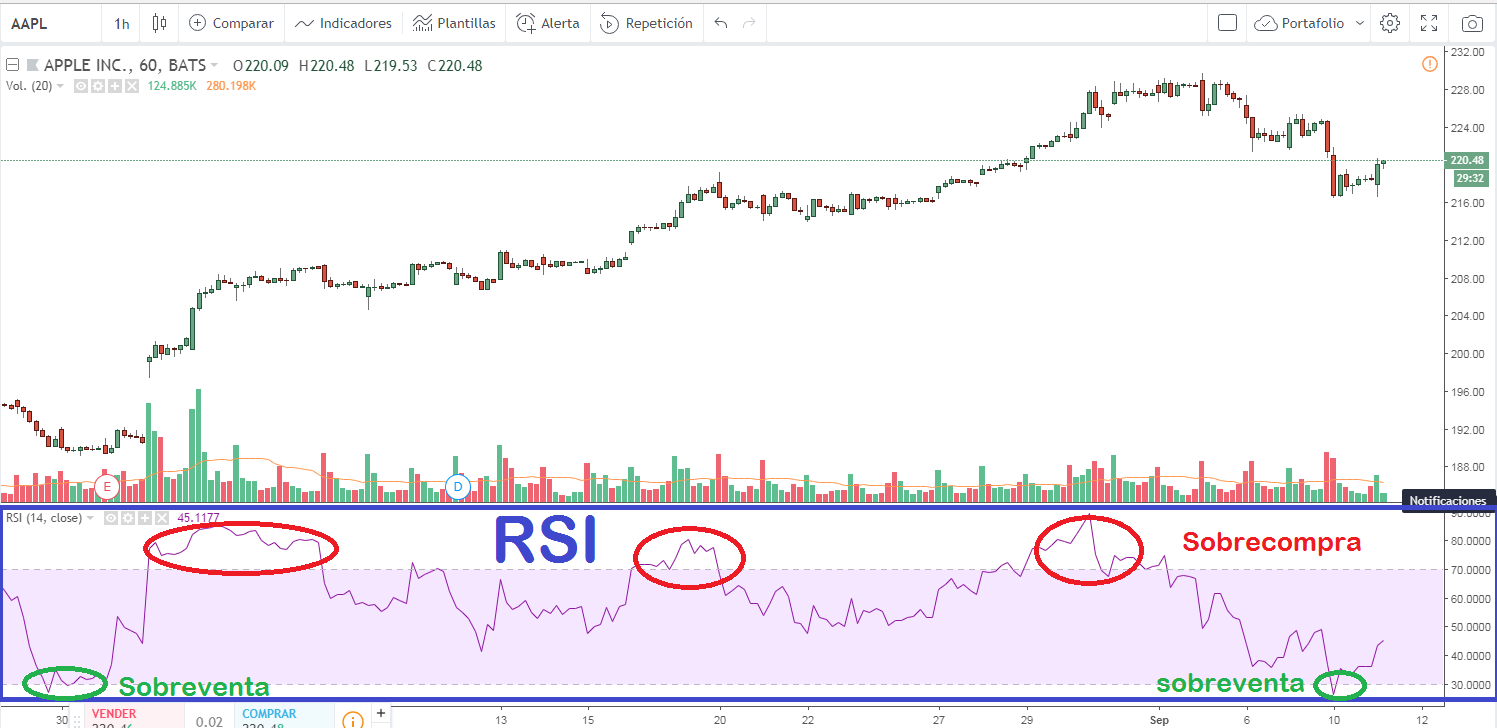
El RSI es un indicador técnico utilizado en el análisis técnico de los mercados financieros. Su función principal es medir la velocidad y el cambio de los movimientos de los precios, lo que ayuda a los traders a identificar condiciones de sobrecompra y sobreventa en un activo financiero.
Cómo Calcular el RSI:
El RSI se calcula utilizando la siguiente fórmula:

Donde RS (Relative Strength) se calcula como la relación entre las ganancias promedio y las pérdidas promedio durante un período determinado.
Utilizando el RSI en tus Estrategias de Trading:
- identificando Condiciones de Sobrecompra y Sobreventa: El RSI puede ayudarte a identificar cuándo un activo está sobrecomprado (RSI > 70) o sobrevendido (RSI < 30). Estas condiciones pueden indicar oportunidades de entrada o salida.
- Divergencias en el RSI: Las divergencias entre el RSI y el precio del activo pueden ser señales poderosas. Una divergencia alcista ocurre cuando el precio baja mientras que el RSI sube, indicando una posible inversión alcista.
- Estrategias de Cruce de Niveles: Algunos traders utilizan estrategias basadas en cruces de niveles clave del RSI, como comprar cuando el RSI cruza por encima de 30 o vender cuando cruza por debajo de 70.
Consejos Avanzados para Usar el RSI:
- Confirma con otros Indicadores: Utiliza el RSI en conjunto con otros indicadores técnicos para tomar decisiones más sólidas.
- Ajusta el Período del RSI: Experimenta con diferentes períodos del RSI para adaptarlo a tu estilo de trading y al activo que estás analizando.
- Controla el Riesgo: Establece límites de pérdida y toma ganancias basados en tus análisis con RSI para gestionar el riesgo de manera efectiva.
- Practica la Disciplina: El RSI es una herramienta, no una garantía de éxito. Mantén la disciplina en tus operaciones y gestiona tus emociones.
Conclusión:
Dominar el RSI en el trading puede marcar la diferencia en tu éxito como trader. Utiliza este indicador de manera inteligente, comprende sus señales y aplica estrategias sólidas para tomar decisiones informadas en el mercado financiero. Recuerda siempre que el trading conlleva riesgos, y la gestión adecuada del riesgo es fundamental para alcanzar el éxito a largo plazo. ¡Buena suerte en tus operaciones!
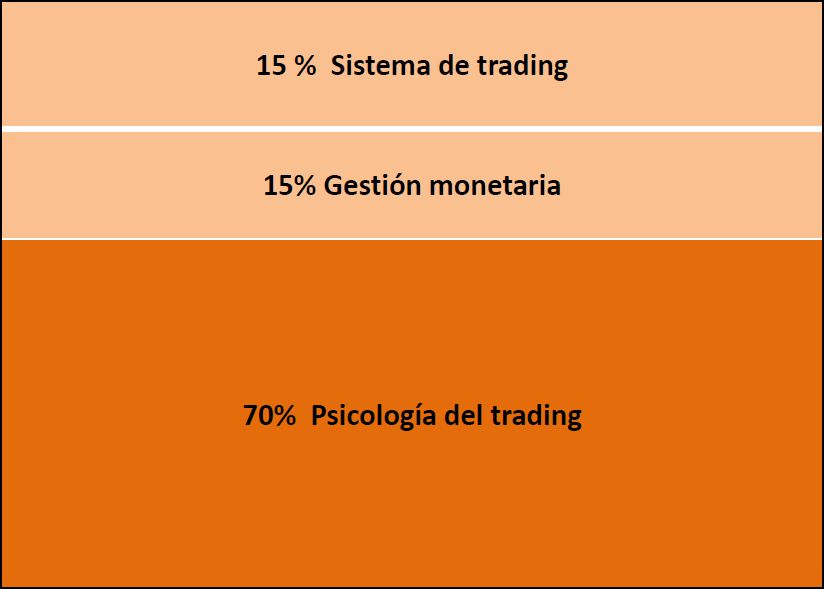
Psicología del Trading: La Clave para el Éxito en los Mercados Financieros
By EGYPTIAN EYE TRADING - septiembre 21, 2023
El mundo del trading es emocionante y repleto de oportunidades para ganar dinero, pero también es un campo que puede ser mentalmente desafiante. La psicología del trading juega un papel crucial en el éxito de un trader. En esta entrada, exploraremos en profundidad cómo la mente de un trader puede influir en sus decisiones, y cómo puedes mejorar tus habilidades psicológicas para convertirte en un trader más exitoso y consistente.

La Batalla Interna del Trader
Cuando se trata de trading, la lucha más feroz no ocurre en los mercados, sino en la mente del propio trader. Aquí hay algunas de las principales emociones y desafíos psicológicos que los traders enfrentan:
- Miedo y Avaricia: Estas dos emociones son las principales enemigas del trader. El miedo puede hacer que te retires de una operación demasiado pronto, mientras que la avaricia puede llevarte a mantener una posición demasiado tiempo.
- Impaciencia y Ansiedad: La impaciencia puede hacer que tomes decisiones impulsivas, mientras que la ansiedad puede impedirte tomar decisiones lógicas.
- Sesgo de Confirmación: Los traders a menudo buscan confirmación de sus creencias preexistentes, lo que puede llevar a la ignorancia de señales de cambio importantes.
- Sobrecarga de Información: El exceso de información puede ser abrumador y paralizar tu capacidad para tomar decisiones.
- Vengarse del Mercado: Tratar de recuperar pérdidas anteriores puede llevar a un ciclo de pérdidas aún mayores.
Cómo Superar los Desafíos Psicológicos del Trading
La buena noticia es que la psicología del trading es algo que se puede aprender y mejorar con el tiempo. Aquí tienes algunas estrategias para superar los desafíos psicológicos:
- Autoconocimiento: Reconoce tus emociones y trabaja en entender cómo afectan tus decisiones. Mantén un diario de trading para rastrear tus emociones.
- Establece Reglas y Síguelas: Crea un plan de trading con reglas claras y objetivas. Sigue tu plan incluso cuando las emociones intenten desviarte.
- Gestión de Riesgos: Limita la cantidad de capital que arriesgas en cada operación para proteger tu cuenta de pérdidas devastadoras.
- Practica la Disciplina: Desarrolla la disciplina para mantenerte enfocado en tu plan de trading y no dejar que las emociones te lleven a tomar decisiones impulsivas.
- Aprende de tus Errores: En lugar de lamentarte por las pérdidas, analiza tus errores y utiliza esa información para mejorar tu estrategia.
Mantener una Mente Saludable para el Trading
La psicología del trading también incluye cuidar tu bienestar mental y emocional en general. Algunas prácticas para mantener una mente saludable incluyen:
- Ejercicio regular: El ejercicio puede ayudar a reducir el estrés y mejorar la claridad mental.
- Meditación y mindfulness: Estas técnicas pueden ayudarte a mantener la calma y reducir la ansiedad.
- Descanso adecuado: Un sueño de calidad es esencial para mantener la concentración y la toma de decisiones efectivas.
Conclusiones
La psicología del trading es un componente esencial del éxito en los mercados financieros. A medida que te adentres en el mundo del trading, no subestimes la importancia de entender y controlar tus emociones. La capacidad de tomar decisiones racionales y mantener la disciplina es lo que separa a los traders exitosos de los que no lo son. Dedica tiempo a trabajar en tu psicología de trading y estarás en un mejor camino hacia el éxito financiero.
Análisis Técnico vs. Análisis Fundamental: ¿Cuál es la Mejor Estrategia de Trading?
By EGYPTIAN EYE TRADING - septiembre 21, 2023
Cuando se trata de tomar decisiones de trading, los traders tienen dos enfoques principales a su disposición: el análisis técnico y el análisis fundamental. Ambos métodos ofrecen perspectivas valiosas sobre los mercados financieros, pero difieren en su enfoque y en las herramientas utilizadas. En esta entrada, desglosaremos las diferencias clave entre el análisis técnico y el análisis fundamental, para que puedas decidir cuál es la estrategia más adecuada para tu estilo de trading.
Análisis Técnico: Descifrando los Gráficos
El análisis técnico se basa en el estudio de los gráficos y patrones de precios históricos de un activo financiero. Los traders técnicos creen que toda la información relevante sobre un activo ya está reflejada en su precio y que los patrones pasados pueden predecir movimientos futuros. Algunos conceptos clave del análisis técnico incluyen:
- Indicadores técnicos: Estos incluyen el RSI (Índice de Fuerza Relativa), las medias móviles y el MACD (Convergencia/Divergencia de Medias Móviles), entre otros. Ayudan a los traders a identificar tendencias y señales de compra o venta.
- Soporte y resistencia: Identificar niveles de soporte (donde los precios tienden a detenerse de caer) y resistencia (donde los precios suelen frenarse al subir) es fundamental para el análisis técnico.
- Candlestick Charts: Estos gráficos ofrecen información detallada sobre el comportamiento de los precios en períodos específicos y son esenciales para identificar patrones de velas.
Análisis Fundamental: Evaluando los Fundamentos
El análisis fundamental, por otro lado, se centra en los fundamentos económicos y financieros de un activo. Los traders fundamentales estudian factores como:
- Informe de ganancias y pérdidas: Evalúan los informes trimestrales y anuales de las empresas para determinar su salud financiera y perspectivas de crecimiento.
- Eventos macroeconómicos: Mantienen un ojo en los acontecimientos económicos globales, como tasas de interés, políticas gubernamentales y eventos geopolíticos que pueden afectar a los mercados.
- Valor intrínseco: Tratan de determinar el valor intrínseco de un activo financiero y compararlo con su precio de mercado actual.
¿Cuál es la Mejor Estrategia?
La elección entre el análisis técnico y el análisis fundamental depende de tu estilo de trading, objetivos y preferencias personales. Algunos traders combinan ambos enfoques para tomar decisiones más informadas. Aquí hay algunas consideraciones finales:
El análisis técnico es útil para el trading a corto plazo y el day trading debido a su enfoque en patrones de precios actuales.
El análisis fundamental es más adecuado para el trading a largo plazo y la inversión, ya que se basa en la evaluación de la salud financiera a largo plazo de una empresa.
Experimenta con ambos enfoques y descubre cuál se adapta mejor a tu estilo y objetivos de trading.
En última instancia, la elección entre análisis técnico y análisis fundamental es tuya, y es importante recordar que no hay una estrategia "mejor" en términos absolutos. Lo que importa es que desarrolles una estrategia coherente y bien fundamentada que te ayude a alcanzar tus metas financieras.
¿Qué es el Trading? Guía Completa para Principiantes
By EGYPTIAN EYE TRADING - septiembre 21, 2023
El mundo financiero está lleno de oportunidades, y una de las actividades más apasionantes y lucrativas es el trading. Pero, ¿qué es exactamente el trading y cómo puedes comenzar a explorarlo? En esta guía completa, desentrañaremos los conceptos básicos del trading y te proporcionaremos los fundamentos necesarios para dar tus primeros pasos en este emocionante mundo.
¿Qué es el Trading?
El trading es el arte de comprar y vender activos financieros, como acciones, divisas, criptomonedas, materias primas y más, con el objetivo de obtener ganancias a partir de las fluctuaciones de sus precios en el mercado. Los traders toman decisiones informadas y estratégicas basadas en el análisis técnico, fundamental y sentimental para aprovechar las oportunidades de inversión.
Tipos de Trading
Existen diferentes enfoques dentro del mundo del trading, como el trading diario, el swing trading y el trading a largo plazo. Cada uno de ellos tiene sus propias estrategias y plazos, lo que significa que puedes encontrar el estilo que mejor se adapte a tu personalidad y objetivos financieros.
Herramientas y Plataformas
Para comenzar en el trading, necesitas acceso a plataformas de trading en línea y herramientas de análisis. A menudo, los traders utilizan corredores en línea y software de gráficos avanzados para realizar un seguimiento de los activos y ejecutar sus operaciones.
Gestión del Riesgo
Una parte fundamental del trading es la gestión del riesgo. Esto implica establecer límites para tus operaciones, utilizar stop-loss y diversificar tu cartera para protegerte de posibles pérdidas significativas.
Educación Continua
El trading es un campo en constante evolución, por lo que la educación continua es esencial. Aprovecha recursos como libros, cursos en línea y comunidades de traders para seguir aprendiendo y mejorando tus habilidades.
Conclusiones
En resumen, el trading es una forma emocionante de participar en los mercados financieros y potencialmente aumentar tus ingresos. Sin embargo, también conlleva riesgos, por lo que es esencial aprender y practicar antes de invertir grandes sumas de dinero. En futuras entradas, profundizaremos en los aspectos clave del trading y te proporcionaremos consejos útiles para tu viaje hacia el éxito financiero.
¿Tienes más preguntas sobre el trading o hay algún tema relacionado que te gustaría explorar? ¡Déjame tus comentarios y estaré encantado de ayudarte en tu camino hacia el mundo del trading!
Domina el Arte del Trading con Alligator: Historia, Configuración y Estrategias Ganadoras
By EGYPTIAN EYE TRADING - septiembre 16, 2023
El trading es un mundo apasionante y desafiante, donde las herramientas adecuadas pueden marcar la diferencia entre el éxito y el fracaso. Una de esas herramientas es el "Alligator," una creación única de uno de los traders más legendarios, Bill Williams. En esta entrada, exploraremos a fondo el Alligator, su historia, cómo funciona y cómo puedes configurarlo y utilizarlo para tomar decisiones comerciales efectivas.
Historia del Alligator: La Creación de Bill Williams
Bill Williams, un trader e inversor prolífico, desarrolló el Alligator como parte de su enfoque del "Sistema de Caos." Este sistema se basa en la idea de que los mercados financieros a menudo siguen patrones caóticos y que estos patrones pueden ser comprendidos y utilizados para tomar decisiones comerciales informadas.
El Alligator es una herramienta de análisis técnico que utiliza tres líneas móviles suavizadas para representar la "mandíbula," "dientes" y "labios" de un cocodrilo (de ahí su nombre). Cada una de estas líneas tiene un período diferente y se utiliza para identificar tendencias y oportunidades en el mercado.
Cómo Funciona el Alligator: Interpretando las Señales
- El Alligator utiliza tres líneas móviles, cada una con su propio período:
- La Línea de la Mandíbula (Jaw): Representada por una línea azul y con un período de 13, esta línea suaviza el precio y la desplaza hacia adelante en el gráfico en 8 barras.
- Los Dientes (Teeth): Representados por una línea roja y con un período de 8, esta línea también suaviza el precio y la desplaza hacia adelante en 5 barras.
- Los Labios (Lips): Representados por una línea verde y con un período de 5, esta línea suaviza el precio y la desplaza hacia adelante en 3 barras.

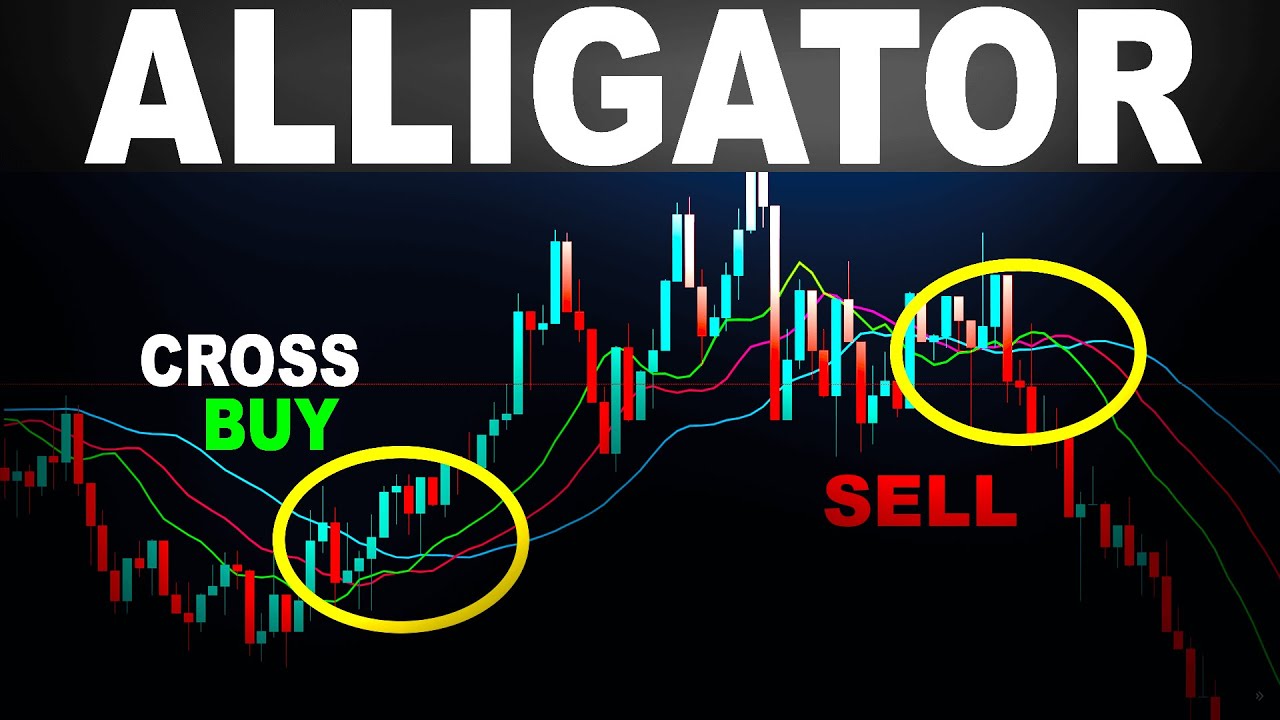
Cuando estas tres líneas se entrecruzan, generan señales clave para los traders:
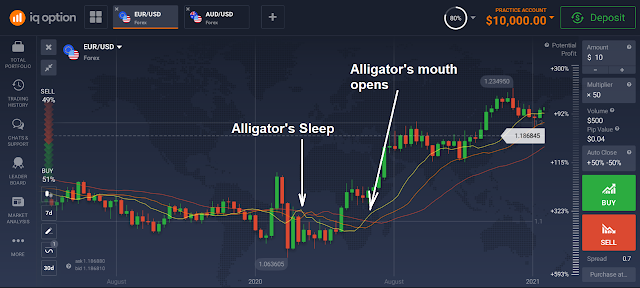
- Cocodrilo Durmiendo: Todas las líneas están cerca una de la otra, indicando que el mercado está en rango o sin tendencia clara. Los traders deben evitar operar en este momento.
- Cocodrilo Despertando: Las líneas empiezan a abrirse y entrecruzarse, lo que sugiere una posible formación de tendencia. Los traders deben estar atentos a las señales adicionales.
- Cocodrilo Comiendo: Todas las líneas se abren en la misma dirección y siguen una tendencia. Esta es la señal para abrir una posición en la dirección de la tendencia predominante.
Configuración del Alligator: Poniendo en Marcha la Herramienta
Configurar el Alligator en tu plataforma de trading es relativamente sencillo. Simplemente sigue estos pasos generales:
- Abre un gráfico en tu plataforma de trading.
- Agrega el Alligator como un indicador técnico.
- Ajusta los períodos de las tres líneas (Jaw, Teeth y Lips) según tus preferencias o según la estrategia que estés siguiendo.
- Personaliza los colores y estilos de las líneas para que sean fáciles de distinguir.
Haciendo Trading con el Alligator: Estrategias Efectivas
Ahora que comprendes cómo funciona el Alligator y cómo configurarlo, es hora de aplicarlo en tus operaciones. Aquí tienes algunas estrategias comunes:
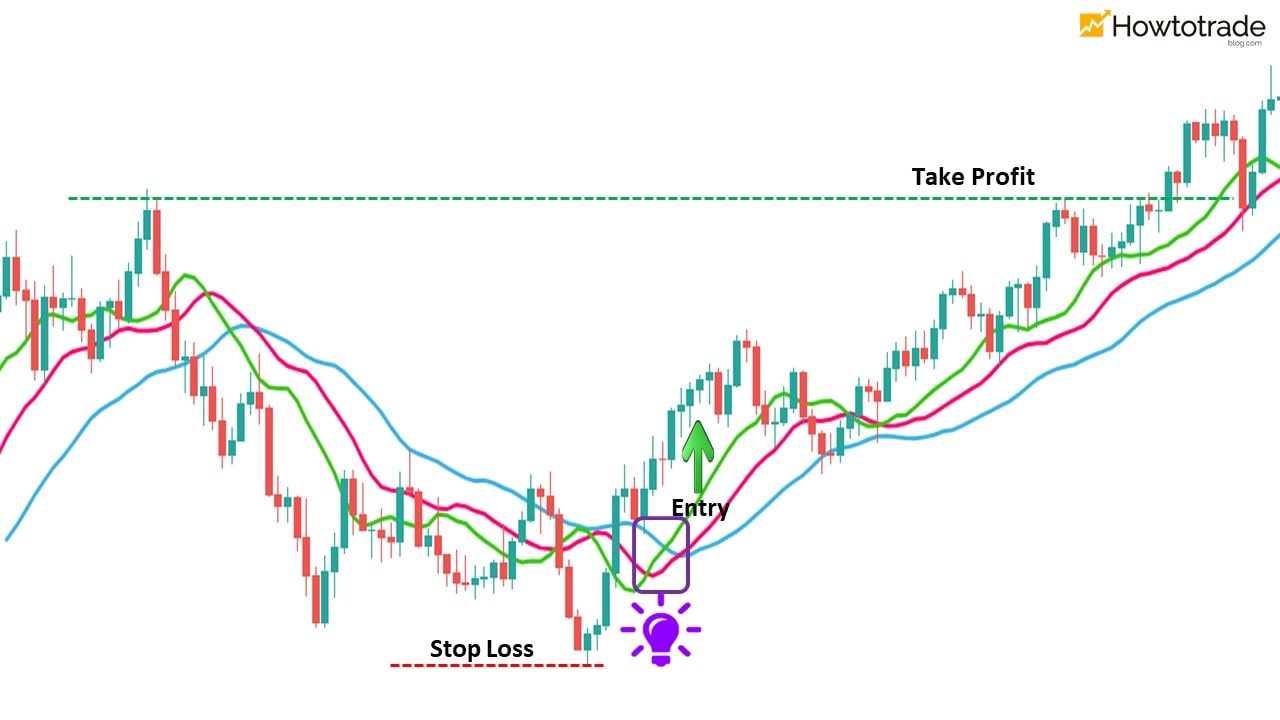
- Estrategia de Cruce de Líneas: Abre posiciones cuando las líneas del Alligator se cruzan en la dirección de la tendencia predominante.
- Estrategia de Continuación de Tendencia: Utiliza el Alligator para confirmar tendencias existentes y abre posiciones en la dirección de esa tendencia.
- Estrategia de Rompimiento: Espera a que el precio rompa las líneas del Alligator y luego abre una posición en la dirección del rompimiento.
- Gestión de Riesgos: Asegúrate de establecer stop-loss y take-profit para proteger tu capital y asegurar ganancias.
Conclusión
El Alligator es una herramienta poderosa para cualquier trader que desee comprender y aprovechar las tendencias del mercado. Con su diseño único y su enfoque en la interpretación de patrones de precios, puede ser una adición valiosa a tu caja de herramientas de trading.
Recuerda que ninguna herramienta es infalible, y siempre es importante complementar tu análisis con una comprensión profunda del mercado y una sólida gestión de riesgos. ¡Utiliza el Alligator con sabiduría y cautela en tu búsqueda de éxito en el mundo del trading!
Si deseas obtener más información sobre estrategias específicas o detalles sobre cómo configurar el Alligator en tu plataforma de trading, no dudes en contactarnos. ¡Felices operaciones!
Dominando el Arte del Trading con EMA: Estrategias y Técnicas Actualizadas
By EGYPTIAN EYE TRADING - septiembre 16, 2023
El mundo del trading es un escenario dinámico donde los inversores buscan constantemente ventajas competitivas. Una herramienta que ha demostrado su eficacia a lo largo del tiempo es la Media Móvil Exponencial (EMA, por sus siglas en inglés). En esta entrada, exploraremos cómo utilizar la EMA en tu estrategia de trading, junto con su historia y su relevancia actual en los mercados financieros.
Historia de la EMA en el Trading
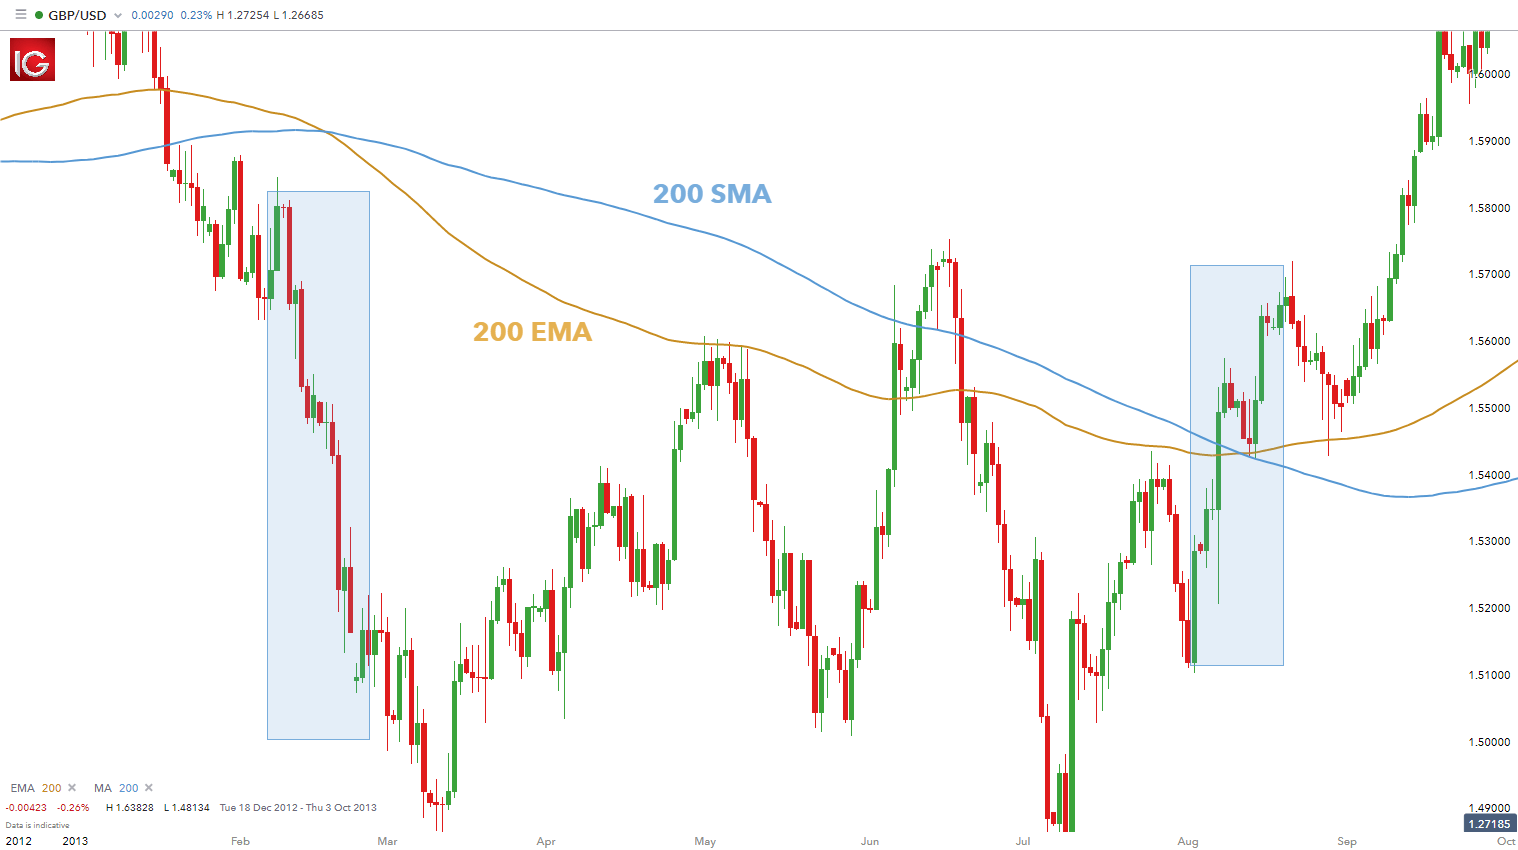
La Media Móvil Exponencial se ha utilizado en el mundo del trading durante décadas. Su origen se remonta a los métodos de análisis técnico desarrollados por los pioneros del trading. La EMA es una versión mejorada de la Media Móvil Simple (SMA) y se ha convertido en una herramienta esencial para los traders.
La EMA asigna un mayor peso a los datos más recientes, lo que la hace más sensible a los cambios en los precios. Esto la convierte en una herramienta valiosa para identificar tendencias y señales de entrada y salida en los mercados financieros.

EMA en el Trading Actual: Estrategias Clave
- Identificación de Tendencias: La EMA es especialmente útil para identificar tendencias en los precios de los activos. Los traders a menudo utilizan dos EMAs con diferentes períodos (por ejemplo, 50 y 200) para identificar cruces que indican cambios en la tendencia.
- Señales de Compra y Venta: Los cruces entre la EMA y el precio son señales comunes para abrir o cerrar posiciones. Un cruce de EMA por encima del precio puede considerarse una señal de compra, mientras que un cruce por debajo del precio puede ser una señal de venta.
- Confirmación de Tendencia: Los traders utilizan la EMA para confirmar la dirección de la tendencia. Si el precio está por encima de la EMA, esto puede confirmar una tendencia alcista, y viceversa.
- Gestión de Riesgos: La EMA también se puede utilizar para establecer niveles de stop-loss y take-profit. Los traders pueden ajustar sus niveles de stop-loss en función de las distancias entre el precio y la EMA.
Conclusiones
La Media Móvil Exponencial es una herramienta versátil y efectiva en el mundo del trading. Su capacidad para identificar tendencias, generar señales de compra y venta, y confirmar la dirección del mercado la convierten en un recurso invaluable para los traders de todos los niveles de experiencia.
Sin embargo, es importante recordar que ninguna herramienta es infalible. La EMA debe utilizarse en conjunto con otros indicadores y un sólido plan de gestión de riesgos. Además, es fundamental estar al tanto de las condiciones del mercado y adaptar tu estrategia en consecuencia.
En resumen, la EMA es una piedra angular en el arsenal de herramientas de cualquier trader. Con una comprensión sólida de su funcionamiento y una estrategia bien elaborada, puedes aprovechar su potencial para tomar decisiones más informadas en tus operaciones. ¡Que tus operaciones sean rentables y tu camino en el trading, exitoso!
Espero que esta entrada sea útil para tu blog sobre trading. Si tienes más preguntas o necesitas información adicional, no dudes en hacérmelo saber. ¡Buena suerte en tus operaciones!